Stress distribution diagram of the bolted joint
The stress-strain diagram of a bolted joint is one of the key tools for evaluation according to the VDI 2230 guideline. It has become a globally recognized method for verifying bolted joints. The stress diagram combines computational results with a clear graphical representation. This enables designers and developers to quickly and reliably evaluate the behavior of a bolted joint under preload and external loading.
Especially in more complex applications, it is not enough to consider individual numerical values. What matters most is the interaction between preload, clamping force, and load. This is exactly where the clamping diagram comes into play.
What does a stress diagram show?
The stress-strain diagram graphically illustrates the force distributions within a bolted joint. It shows how the bolt force and clamping force change when an external operating force is applied.
It's clear at a glance that,
-
how much preload the screw has
-
how the clamping force decreases under load
-
what is the maximum screw force that occurs during operation
- what is the minimum residual clamping force still available

This makes it possible to determine whether the screw is operating within the permissible limits and whether the required residual clamping force can be ensured.
Why stress diagrams are Design in Design
In practice, bolted joints often need to be adjusted or re-evaluated. Changes to materials, bolt sizes, preload methods, or load assumptions have a direct impact on the safety of the joint.
The stress diagram makes it possible to visualize such changes immediately. Instead of comparing multiple tables or spreadsheets, the diagram shows at a glance how close the connection is to critical limits.
This visualization offers a decisive advantage, especially when coordinating Design, calculations, and project management. It fosters a shared understanding, even among those who don’t spend their days crunching numbers.
Comparison of Options in Screw Design
In engineering practice, a bolted joint is rarely finalized on the first attempt. Often, several options are considered: a larger or smaller bolt, a different strength class, a different preload, or an alternative clamping configuration. Each of these decisions affects the mechanical behavior of the joint—sometimes significantly, sometimes only in subtle ways.
In such cases, raw numerical values from tables or results lists are often insufficient for reliably assessing differences. While it is possible to compare maximum bolt force, residual clamping force, or safety factors, the interplay between these variables remains abstract. This is precisely where the graphical comparison of variants demonstrates its added value.
By directly comparing two stress diagrams, it becomes clear how a design change actually affects the load distribution in the bolted joint. Differences in the slope of the force lines, the variation in clamping force, or the distance to the yield point can be immediately identified—without having to go through multiple calculation steps.

The variant comparison is particularly well-suited for the following questions:
-
Which screw size offers the greater safety margin?
-
How does the residual clamping force change when the preload is adjusted?
-
Which version is more resilient to changes in external load?
- What is the effect of a more precise installation (lower tightening factor)?
Instead of examining each variant in isolation, a visual comparison allows for a direct technical evaluation on an equal footing. This simplifies Design decisions Design as coordination with project management, quality assurance, or external partners.
Especially in iterative design processes, this transforms a purely mathematical task into a transparent and traceable decision-making process—supported by clearly structured stress diagrams that not only calculate differences but also make them easy to understand.
Stress diagram as part of the technical documentation
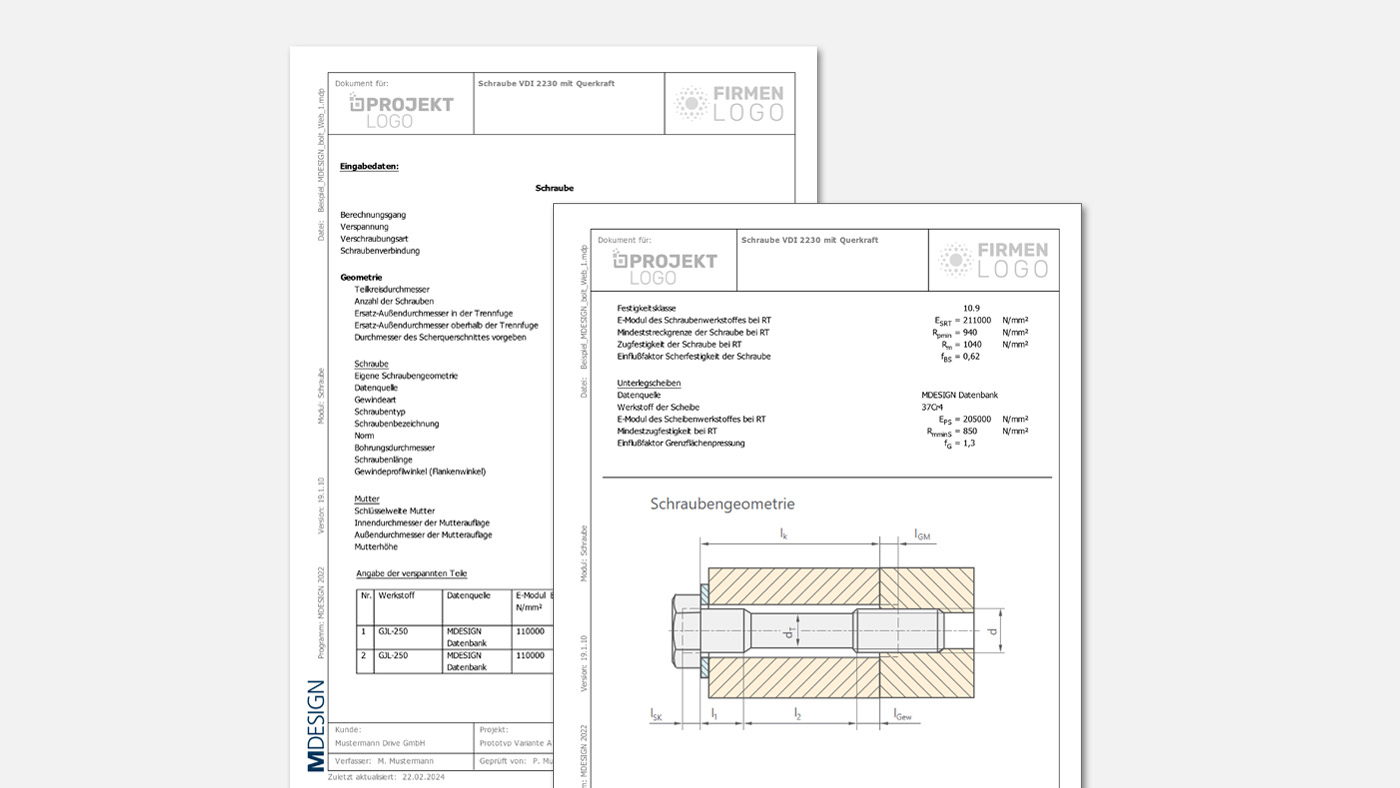
In addition to the design itself, documentation is also becoming increasingly important. Calculations must be transparent, verifiable, and available for the long term. The stress diagram plays a key role in this regard, as it clearly illustrates the mechanical behavior of the bolted joint.
In technical documentation, it serves not only as an internal decision-making tool but also as part of the supporting documentation, for example in the context of project approvals or subsequent audits.
Practical relevance: Standardization rather than individual, ad-hoc solutions
Bolt connections are still frequently calculated using custom Excel spreadsheets or in-house tools. While these solutions work from a technical standpoint, they are often difficult to understand, lack consistent documentation, and are hard to maintain over the long term.
Standardized calculation methods with clearly structured stress diagrams provide a solution here. They ensure comparability, transparency, and consistent documentation across projects.
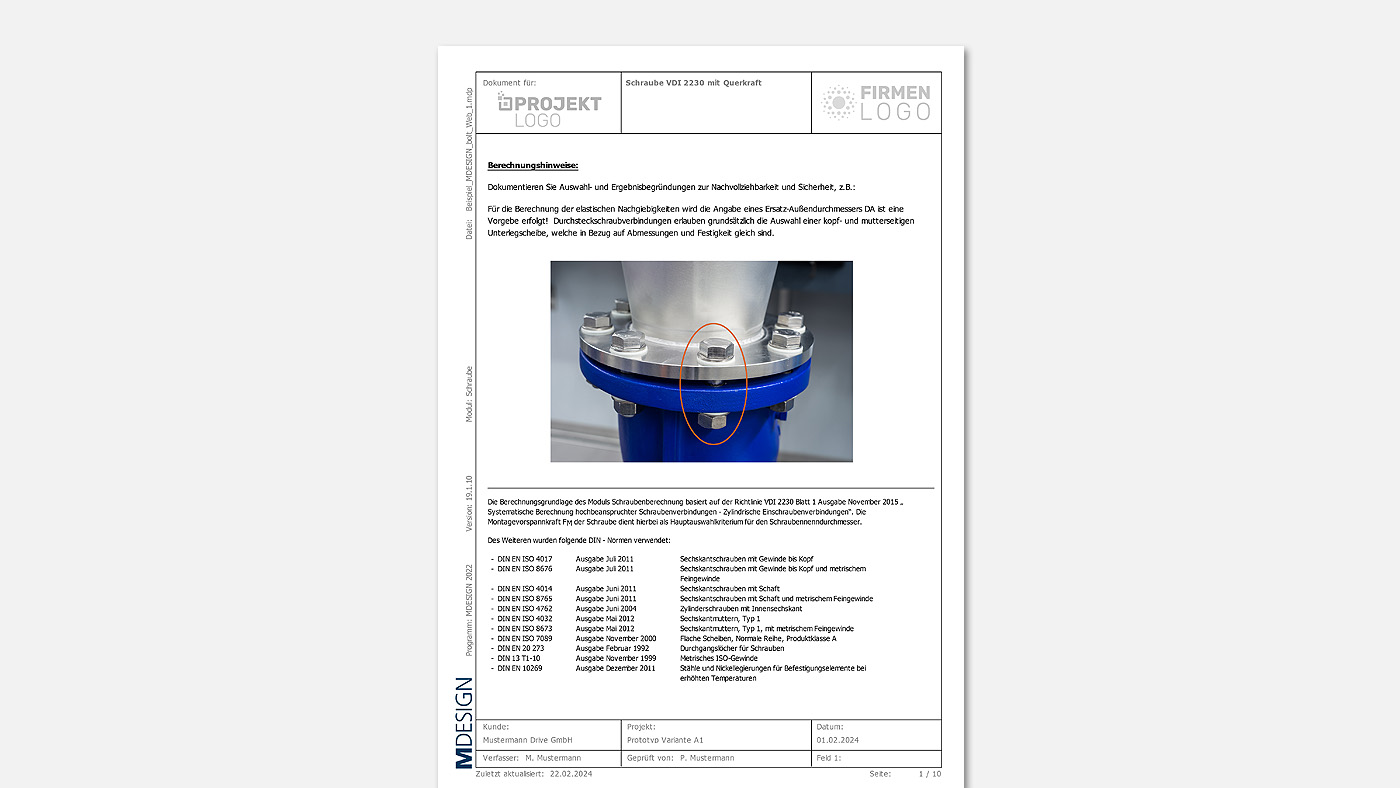
Calculation systems such as MDESIGN support this approach by combining standard-based bolt calculations with clear stress diagrams and automatically generated calculation documents.
In light of the new EU Machinery Regulation (EU) 2023/1230 , this transparency becomes even more important. In the future, technical evidence must not only be mathematically correct but also documented in a traceable manner. Graphical analyses such as the stress diagram support this requirement precisely because they present calculation results in an understandable way and provide plausible justifications for design choices.
This transforms what would otherwise be a purely mathematical task into a structured decision-making process, particularly in iterative design processes. Clearly structured stress diagrams help to reliably evaluate design changes and provide a sound technical justification for the chosen solution—both internally and externally.
Related articles:



Conclusion
Anyone who calculates bolted joints in accordance with VDI 2230 cannot do without a clear graphical analysis. It combines mathematical precision with technical insight and lays the foundation for safe and verifiable designs.